


Green building is here to stay, but complying with all the new recycling laws and regulations increases your cost of doing business. We all want to help the environment, especially because 40% of all waste sent to landfills is generated from construction. Creating an effective waste management plan for your construction project, salvaging materials, source separation, and using facilities that truly recycle materials is the key.
So how can you do all this for less and make a difference? Green Halo!
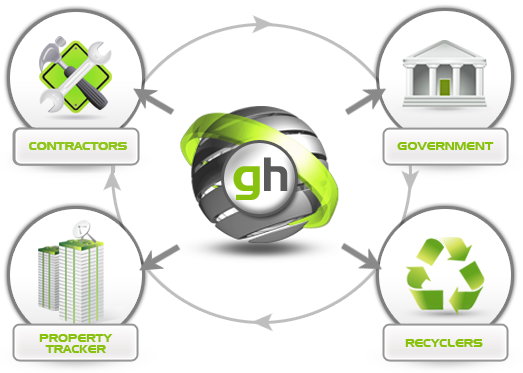
Green Halo saves you time and money and provides you with the tools you need to identify materials that can be recycled, locate the nearest recycling facilities, track your recycling progress in real-time, and generate comprehensive statistics and reports for your project, clients, company, government, and LEED. Green Halo’s cloud based platform is easy to use and accessible through any mobile device, providing you, your subcontractors, and your clients with anywhere, anytime access to your recycling data.
To learn more about Green Halo and how we can help you, click here to schedule your demo now for an online demo with one of our representatives.
Green Halo, recycling today’s resources for tomorrow’s generations.
Call to schedule a demo today at 1-888-525-1301

Recovery Reports for August

Recovery Rate
Recovery Rate
Recovery Rate
| 1. | Mixed C & D Debris | 3,800,347.54 | 56.50% |
| 2. | Dirt/Soil-Clean Fill | 1,382,361.81 | 20.55% |
| 3. | Dirt/Soil-Contaminated Non-Hazardous | 658,687.76 | 9.79% |
| 4. | Concrete | 384,191.88 | 5.71% |
| 5. | Asphalt - Pavement & Grinding | 114,779.96 | 1.71% |
| 6. | Rock, Sand, Gravel & other inerts | 86,885.85 | 1.29% |
| 7. | Waste (Trash) | 75,417.14 | 1.12% |
| 8. | Metal | 53,488.93 | 0.80% |
| 9. | Deconstructed & Reuse Items | 43,492.55 | 0.65% |
| 10. | Dirt/Soil-Contaminated, Hazardous | 32,858.48 | 0.49% |
| 11. | Mixed Recyclables | 19,413.90 | 0.29% |
| 12. | Wood - Clean | 14,952.53 | 0.22% |
| 13. | Dirt/Soil-Hazardous | 14,132.30 | 0.21% |
| 14. | Miscellaneous Debris | 12,613.48 | 0.19% |
| 15. | Green Waste | 6,251.93 | 0.09% |
| 16. | Drywall - Clean/Unpainted | 6,052.69 | 0.09% |
| 17. | Bricks, Masonry & Stone Products | 5,651.84 | 0.08% |
| 18. | Asphalt - Roofing | 4,059.33 | 0.06% |
| 19. | Alternate Daily Cover (ADC) | 2,513.41 | 0.04% |
| 20. | Other Hazardous Waste & Materials | 1,905.77 | 0.03% |
| 21. | Materials Containing Asbestos | 1,647.58 | 0.02% |
| 22. | Wood - Treated/Hazardous | 1,163.83 | 0.02% |
| 23. | Drywall - Demo & painted | 647.58 | 0.01% |
| 24. | Cardboard & Paper Products | 538.19 | 0.01% |
| 25. | Carpet & Padding | 455.20 | 0.01% |
| 26. | Appliances & Equipment | 359.89 | 0.01% |
| 27. | Wood - Pallets | 303.51 | 0.00% |
| 28. | Stucco/Plaster - Clean No Debris | 297.90 | 0.00% |
| 29. | Ceiling Tiles | 179.12 | 0.00% |
| 30. | Plastics & Plastic Packaging Materials | 112.50 | 0.00% |
| 31. | Wood - Painted/Stained Recoverable | 110.95 | 0.00% |
| 32. | Bulky Miscellaneous Items | 102.27 | 0.00% |
| 33. | Glass Plate or Tempered | 79.30 | 0.00% |
| 34. | Universal Waste - Other | 57.12 | 0.00% |
| 35. | Trash Sorted for Recovery | 34.83 | 0.00% |
| 36. | Materials with Lead-Based Paint | 27.16 | 0.00% |
| 37. | Porcelain | 17.01 | 0.00% |
| 38. | Compost | 15.56 | 0.00% |
| 39. | Donated Food | 10.62 | 0.00% |
| 40. | eWaste | 9.25 | 0.00% |
| 41. | EPS Styrofoam | 1.67 | 0.00% |
| 42. | Plastic Drums, Barrels, Buckets, and Plastic Containers | 0.15 | 0.00% |
| 43. | Fluorescent Bulbs | 0.03 | 0.00% |
| 44. | Aluminum Cans | 0.01 | 0.00% |
| 45. | Paint | 0.01 | 0.00% |
| 46. | Batteries | 0.00 | 0.00% |
| 47. | Aritificial Grass/Synthetic Turf | 0.00 | 0.00% |
| 48. | Solvents and Other Liquid Chemicals | 0.00 | 0.00% |
| 49. | Shredded Paper | 0.00 | 0.00% |
| 50. | Septic Waste | 0.00 | 0.00% |
| 51. | Thermostats & Mercury - Containing Equipment | 0.00 | 0.00% |
| 52. | Water | 0.00 | 0.00% |
| 53. | Trash to Energy | 0.00 | 0.00% |
| 54. | Car Batteries | 0.00 | 0.00% |
| 55. | Tires | 0.00 | 0.00% |
| 56. | Compostable Food Waste | 0.00 | 0.00% |
| 57. | Textiles | 0.00 | 0.00% |
| 58. | Fats, Oil and Grease (FOG) | 0.00 | 0.00% |
| 59. | Mixed Food Waste | 0.00 | 0.00% |
| 60. | Glass Bottles & Containers | 0.00 | 0.00% |
| 61. | Molded Fiberboard | 0.00 | 0.00% |
| 62. | High-Density Polyethylene (HDPE) | 0.00 | 0.00% |
| 63. | Ink Toner and Cartridges | 0.00 | 0.00% |
| 64. | Liquid Recyclables | 0.00 | 0.00% |
| 65. | Metal Drums, Barrels & Buckets | 0.00 | 0.00% |
| 66. | Motor Oil | 0.00 | 0.00% |
| 67. | Mulch | 0.00 | 0.00% |
| 68. | Plastic Bottles & Containers | 0.00 | 0.00% |
| 69. | Low-Density Polyethylene (LDPE) | 0.00 | 0.00% |
| 70. | PCBs - Polychlorinated Biphenyls | 0.00 | 0.00% |
| 71. | Paper Products | 0.00 | 0.00% |
| 72. | Paint - oil based | 0.00 | 0.00% |
| 73. | Paint - water based | 0.00 | 0.00% |
| 74. | PS Food Trays | 0.00 | 0.00% |

Carbon Footprint
Saving
6,100,690.89
|

Barrels of oil
saved
14,187,653.24
|

Homes powered for
1 month
760,684.65
|

Gallons of gasoline
saved
683,933,956.41
|

Vehicles removed from
road for 1 year
1,196,213.90
|

Tree carbon processing
equivalent
156,427,971.57
|

 Waste Management
 Recovery Report
 CalGreen Reporting
 LEED Reporting
 Source Separating
 Track Recycling
 Construction Recycling
 Waste Tracking

